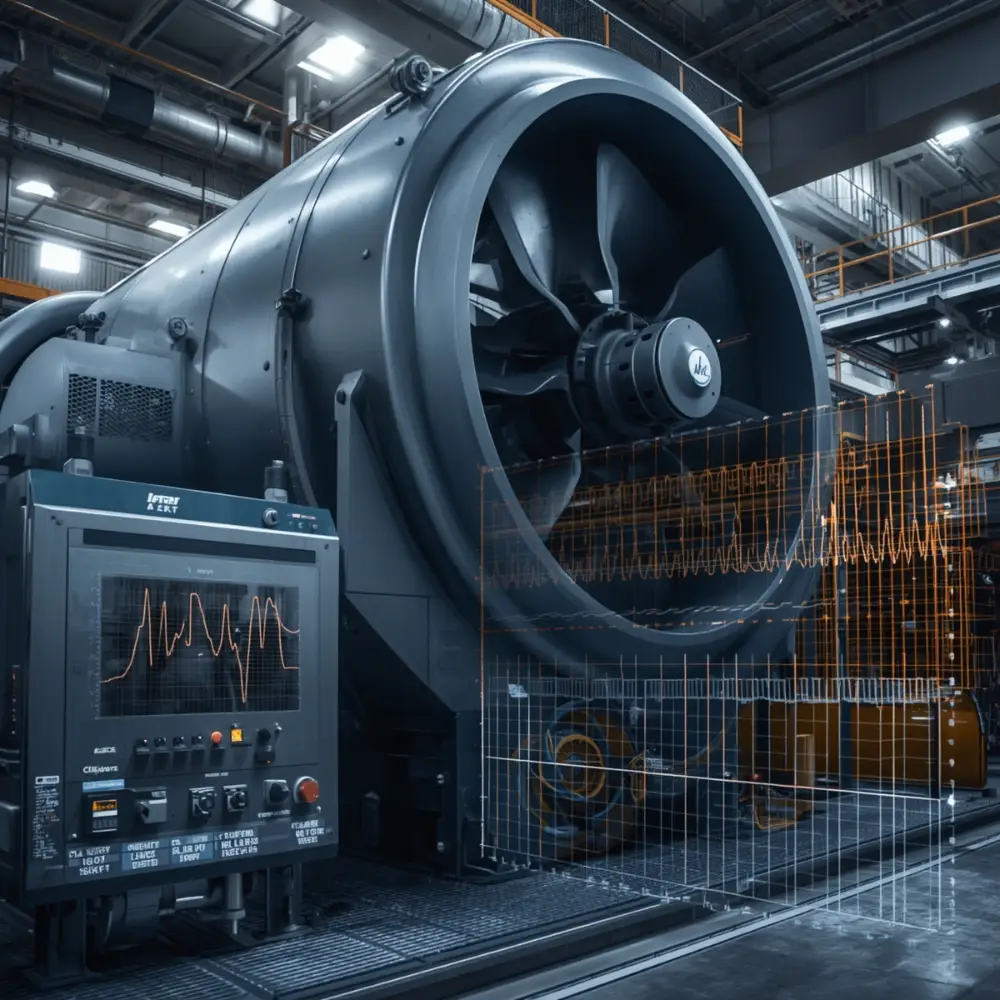
A bearing the size of your fist can take an entire production line down. When it finally seizes, the failure looks sudden. It almost never is. By the time a bearing is hot to the touch, or you can hear it from across the plant floor, it has been telling you it was failing for weeks, sometimes months. The plant just wasn’t set up to listen.
That gap, between the moment a fault becomes detectable and the moment it forces an unplanned shutdown, is the whole game in rotating-machine reliability. Vibration analysis is how you work inside that gap instead of getting caught at the end of it.
Failure is a process, not an event
Reliability engineers describe the life of a developing fault with the P-F interval: the time between the point a problem first becomes detectable (P) and the point the machine actually fails to do its job (F). The longer that interval, and the earlier in it you detect the fault, the more options you have, order the part, schedule the work into a planned outage, avoid the collateral damage a seized bearing does to a shaft or housing.
Vibration changes sit very early on that curve. A bearing starts shedding microscopic spalls long before it generates heat, and far earlier than it produces audible noise. Wait for heat or sound and you have already burned most of the interval. Measure vibration and you buy back weeks of warning.
What vibration analysis actually measures
Every rotating machine has a vibration signature, a baseline pattern of how it shakes when it is healthy. Analysis is the discipline of reading that signature and spotting the moment it changes. Three things carry the information:
- Amplitude, how much the machine is moving. A rising trend is the first thing that gets attention.
- Frequency, how often, expressed as multiples of running speed (1x, 2x) or as specific defect frequencies. This is what tells you which component is at fault.
- The spectrum and time waveform, the FFT spectrum breaks the vibration into its frequency components so a single peak can be traced to a single cause; the time waveform catches impacts the spectrum can smooth over.
On their own, the raw numbers mean little. Compared against a healthy baseline and a known set of fault patterns, they point straight at the problem.
Four faults, four fingerprints
The majority of rotating-equipment problems fall into four families, and each leaves a recognisable pattern:
- Unbalance, a dominant peak at 1x running speed, mostly radial. Common after a fan picks up product build-up or loses a balance weight.
- Misalignment, peaks at 1x and 2x, often with high readings in the axial direction. One of the most common and most preventable faults on coupled machines.
- Mechanical looseness, a series of running-speed harmonics (1x, 2x, 3x and up) and a raised noise floor. Loose hold-down bolts, worn fits, a cracked foundation.
- Bearing defects, non-synchronous frequencies that don’t line up with running speed (the bearing’s own BPFO, BPFI, BSF and FTF tones), usually high in the spectrum and best surfaced with enveloping.
Bearing failure in particular moves through stages. Early on, the only sign is ultrasonic energy. Then discrete defect frequencies appear. Then those frequencies grow harmonics and sidebands as the damage spreads. Only in the final stage does the noise floor lift and the 1x peak climb, and by then failure is close. A monitoring program is built to catch the first two stages, while you still have weeks to act.
Route-based checks, or continuous watch?
Two models cover most plants. Route-based monitoring sends an analyst around the plant on a fixed schedule with a portable data collector, taking readings at set points on each machine. It is cost-effective and works well for the bulk of balance-of-plant equipment.
Continuous online monitoring puts permanent sensors on the machine and streams data without anyone walking the route. It earns its cost on the assets you can’t afford to lose, that sit in hazardous or hard-to-reach locations, or that can fail faster than your route interval. Most mature programs run both, matched to how critical each machine is.
The analyst matters as much as the instrument
Collecting vibration data is easy. Interpreting it is the skill that separates a useful program from a wall of charts nobody acts on. That is why the ISO 18436 standard defines categories of certified vibration analyst, and why it is worth knowing who is reading your data.
ALPS MSI’s analysts are trained to ISO 18436 methodology through the Mobius Institute, and the company runs its own training arm, LAD Training & Certification, for exactly this reason. The instrument finds the signal; the analyst tells you what it means and what to do about it.
What this means if you run the plant
Translate the technical into the operational and it comes down to one trade: a fault caught early becomes a planned job, part on the shelf, work scheduled into an outage window, no collateral damage. The same fault caught late becomes an emergency, overtime, expedited freight, a shaft or housing taken out alongside the bearing, and a line down while everyone waits. Vibration analysis is how you keep moving problems from the second column into the first.
How ALPS approaches it
Vibration analysis sits inside ALPS MSI’s Reliability Engineering service and its wider Energy and Asset Health Management programs. We run route-based and continuous monitoring using Acoem condition-monitoring systems, read by ISO 18436-certified analysts, with the findings turned into a clear action list rather than a data dump.
Start small. Book a baseline assessment on your five most critical machines and see what your equipment has been trying to tell you. Book a free plant assessment.